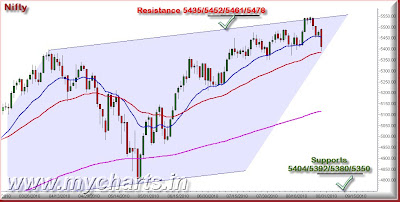
(2) Nifty Chart For 30/08/2010 ::

Nifty :: Engulfing line bearish candle and Bearish treading candle takeover pattern with volume.. Price and bias turn negative but still time positive.. NSI didn’t break last low and may be create divergence as far as price take support at low on Monday.. Vix, as per prediction zoom extreme above 14%, required cool down for one or two day’s.. All this extra indicator with international market positive movement say’s avoid sell at low without conformation... Our strategy for 30th Aug watch 5404, if Nifty hold support 5404 then buy in deep (S.L 5392) sell at high.. If Nifty open gap up watch strong resistance zone 5452 to 5478, if face resistance near this zone then change strategy as sell at high (S.L 5490) buy in deep (S.L 5392).. Resistance for up move at 5435/5452/5461/5478. Supports at 5404/5392/5380/5350..